Hi all,
I am joined by Ruth this week, who has been giving back to the community some amazing fitness garmin resources.
She was kind enough to have a chat with me about it in more detail.
Find our conversation below,
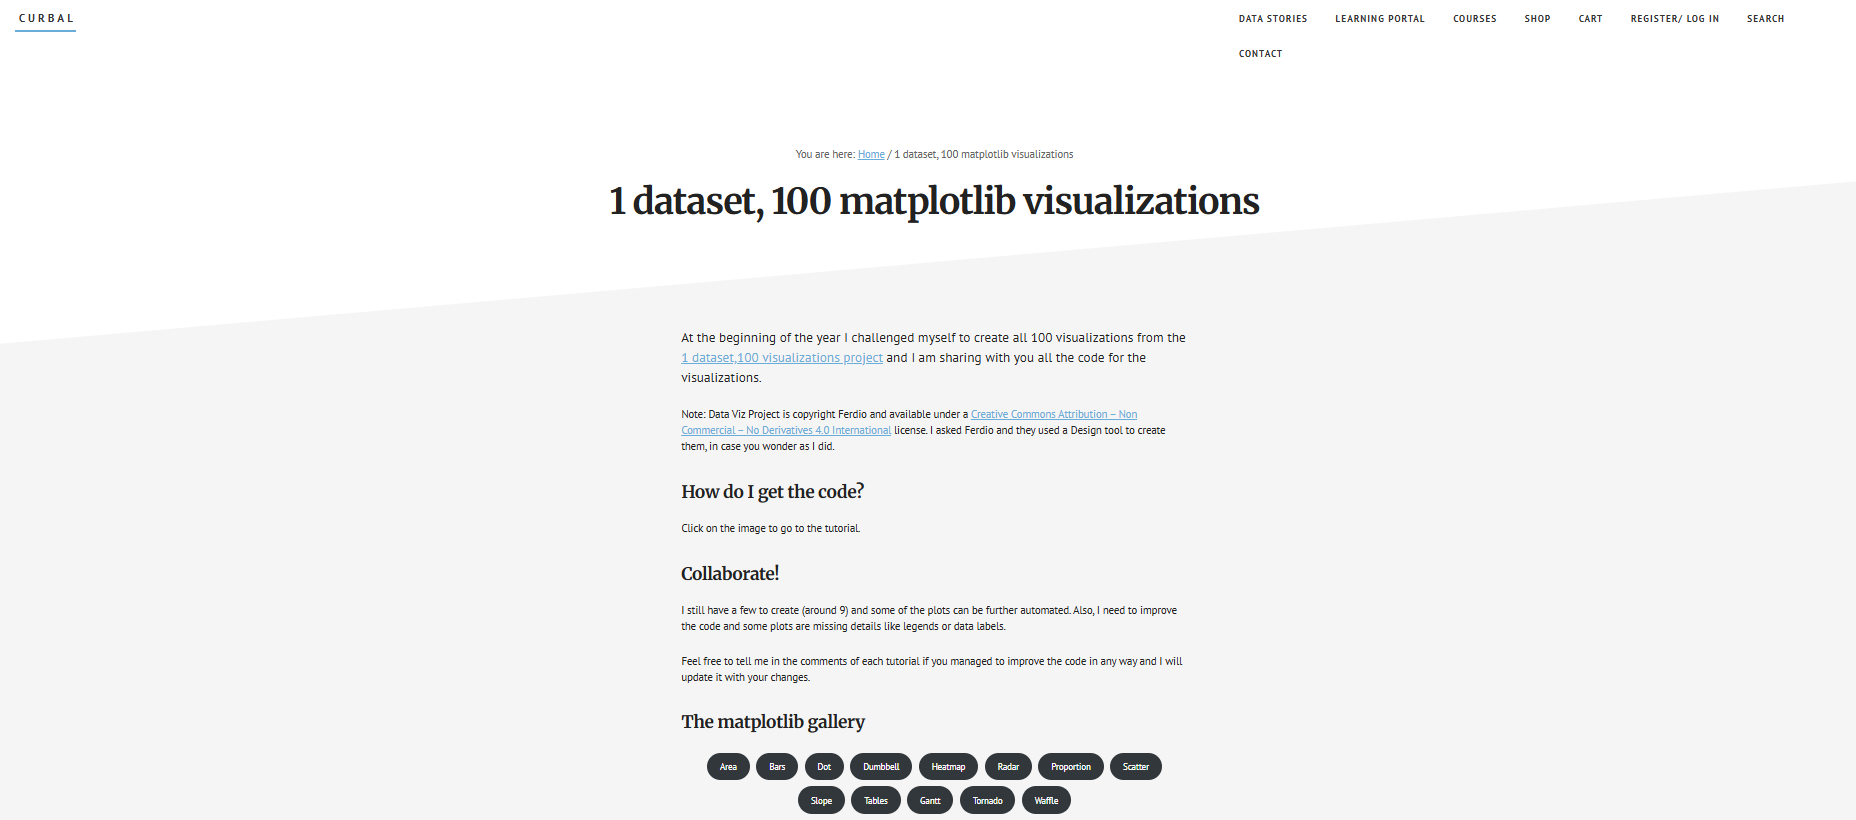
CJ: Before we jump in. Am I right in assuming you got into data through boutique BI consulting? R: I think I have always been into data, but it was when I started Curbal (https://curbal.com) that I could do that for a living.CJ: What is it that you find so exciting about Matplotlib. I see you managed to recreate quite the famous “1 dataset, 100 visualisations”. How does the flexibility suit some of those graph types? Were there any stand out visuals that were particularly challenging? Thank you for sharing the code with us!R: You can do anything you want with matplotlib. You can control every single pixel on the visualization and for me it doesn’t get any more powerful than that. I can not blame it on the tool, if my visualization is not good it is because of my data/design skills, there is no hiding… haha!The challenges I still have left for the 1 dataset, 100 matplotlib visualizations (https://curbal.com/1-dataset-100-matplotlib-visualizations) are to curve text and to pack circles. It is possible, but it is not included in matplotlib by default making it harder for my current skills to do.CJ: Here are a few of my favourites from Ruth's work in the collection. (40 & 76)
With number 40 I love the step ladder and gradient jump / leap. It's a nice play on progression and a more basic arc chart. The movement up and right simultaneously really adds to the leap effect.
My other favourite is this isometric design. I like the uniformity to it, almost like a filing cabinet?
CJ: We have seen a large shift to people wanting to use “tools”. Your elevation profile plot allows just for this, It’s great you make it available for everyone. What are some of the complexities behind making something like this? R: I am hosting the tool at pythonanywhere (https://eu.pythonanywhere.com/) and they make this stuff as easy as it gets. I am in their hacker plan, which means not a lot of compute or space so I can’t keep those files in the app, but even if I could, for privacy reasons I wouldn’t do it.CJ: Recently you’ve shared a little around new projects on elevation profiles, through garmin connect data. For those looking to get started with Garmin connect data, where would you recommend starting?
R: This one lets you compare the elevation profiles of two GPS or GPX tracks — really useful if you're training for a specific event and want to see how your training route stacks up against the actual race course.
In short it,
Simplifies the tracks using the Ramer–Douglas–Peucker algorithm to calculate total ascent/descent and the difficulty of climbs and descents.
Difficulty is measured by multiplying the slope grade by the distance — a value of 1000 marks a Category 1 climb, 2000 is Category 2, and so on.
Choose slope type (ascent or descent) using the dropdown.
Segments setting controls how much the track is simplified. A lower number = more detail. Start with 10 and tweak as needed.
Processing time is about 30 seconds for an average-sized GPX file.
Check it out here.
The other project I created is if you want to visualize your activities on a 3D elevation map, you can do it now here.
CJ: Note as its a gpx file this will also work with exporting your strava data!Garmin does not have a public API, so the “easiest” way to get the data is use a python package called garminconnect (https://github.com/cyberjunky/python-garminconnect) . I do have a developer account with Garmin, so hopefully by the end of the year people will be able to connect their own data to get my visualizations. Fingers crossed!CJ: When we caught up, you walked me through some of your personal garmin metrics for aerobic and anaerobic training, and told me how you automated the refresh process. Could you give a little context as to the steps involved in something like this through the data retrieval, capture, transformation and then visually displaying it on your site? (Pillars of Endurance Running) What tech stack would someone need to know?R: For public use I recommend using the garminconnect python package (https://github.com/cyberjunky/python-garminconnect) and then use my own server to schedule the scripts that send the data to a database. From there I have other scripts that grab the data and create the visualizations. Once they are ready, I use the pythonanywhere api to push the images to the app. I was doing everything on pythonanywhere but it takes too long to produce the visuals, so this was a better approach.So the tech stack would be: python (mainly, flask or django and matplotlib) and sqlCJ: It’s exciting to see you are training for Lidingöloppet 30km using the Garmin coach. How has revisualising all this data helped support your training? Has it had significant improvements on your performance?R: Oh yes! I have never been faster.I realized a few things with Garmin coach: there is an efficient way to run and you should try to learn it. Garmin data will let you know if you get better at it (https://www.garmin.com/en-US/garmin-technology/running-science/running-dynamics/)Knowing what your aerobic and anaerobic threshold is, helps planning the races and training.The data also lets you know how much water you lost, the calories for the run, things like that that helps you plan similar runs and food intake better.I could go forever, but to answer your second question, I just finished a project that clusters all runs made on the same/similar track so I can check if i am getting faster.I have picked a few that are relevant for the lidingöloppet and it looks like I am indeed getting faster. That chart is at the end of the page for the anaerobic runs (https://www.curbal.world/anaerobic_training). It also updates automatically as I do more runs on those tracks, so I just need to focus on running faster!CJ: What is next for you in the health and fitness data world?R: I have soooo many projects I want to do:1. I want to have a better follow up of the Garmin coach program 2. Create my own “year in review” (this is one step towards that: https://www.curbal.world/gpx_poster) 3. I want to be able to profile the race courses better so I can plan race day better. The elevation comparison is part of that work.4. I want to be able to analyze my running technique starting with my vertical oscillation. Python has great packages for that….The list goes on and on!As a fun side note, remember that I told you my partner calls me Ivan Drago? Here is why.
CJ Round-up: It was so much fun chatting with Ruth. What better way to spend time than nerding out over data, and also talking about a shared love for running and passing stories on some of our training plans (or lack of in my case!)
I hope the above conversation gets you excited to explore some of your own health metrics, be it through garmin or beyond - One thing I know is I'm excited to see how some of these new projects formulate in coming months for Ruth.
LOGGING OFF,
CJ
 CJ: What is it that you find so exciting about Matplotlib. I see you managed to recreate quite the famous “1 dataset, 100 visualisations”. How does the flexibility suit some of those graph types? Were there any stand out visuals that were particularly challenging? Thank you for sharing the code with us!
R: You can do anything you want with matplotlib. You can control every single pixel on the visualization and for me it doesn’t get any more powerful than that. I can not blame it on the tool, if my visualization is not good it is because of my data/design skills, there is no hiding… haha!
CJ: What is it that you find so exciting about Matplotlib. I see you managed to recreate quite the famous “1 dataset, 100 visualisations”. How does the flexibility suit some of those graph types? Were there any stand out visuals that were particularly challenging? Thank you for sharing the code with us!
R: You can do anything you want with matplotlib. You can control every single pixel on the visualization and for me it doesn’t get any more powerful than that. I can not blame it on the tool, if my visualization is not good it is because of my data/design skills, there is no hiding… haha!
 The challenges I still have left for the 1 dataset, 100 matplotlib visualizations (https://curbal.com/1-dataset-100-matplotlib-visualizations) are to curve text and to pack circles. It is possible, but it is not included in matplotlib by default making it harder for my current skills to do.
CJ: Here are a few of my favourites from Ruth's work in the collection. (40 & 76)
The challenges I still have left for the 1 dataset, 100 matplotlib visualizations (https://curbal.com/1-dataset-100-matplotlib-visualizations) are to curve text and to pack circles. It is possible, but it is not included in matplotlib by default making it harder for my current skills to do.
CJ: Here are a few of my favourites from Ruth's work in the collection. (40 & 76)
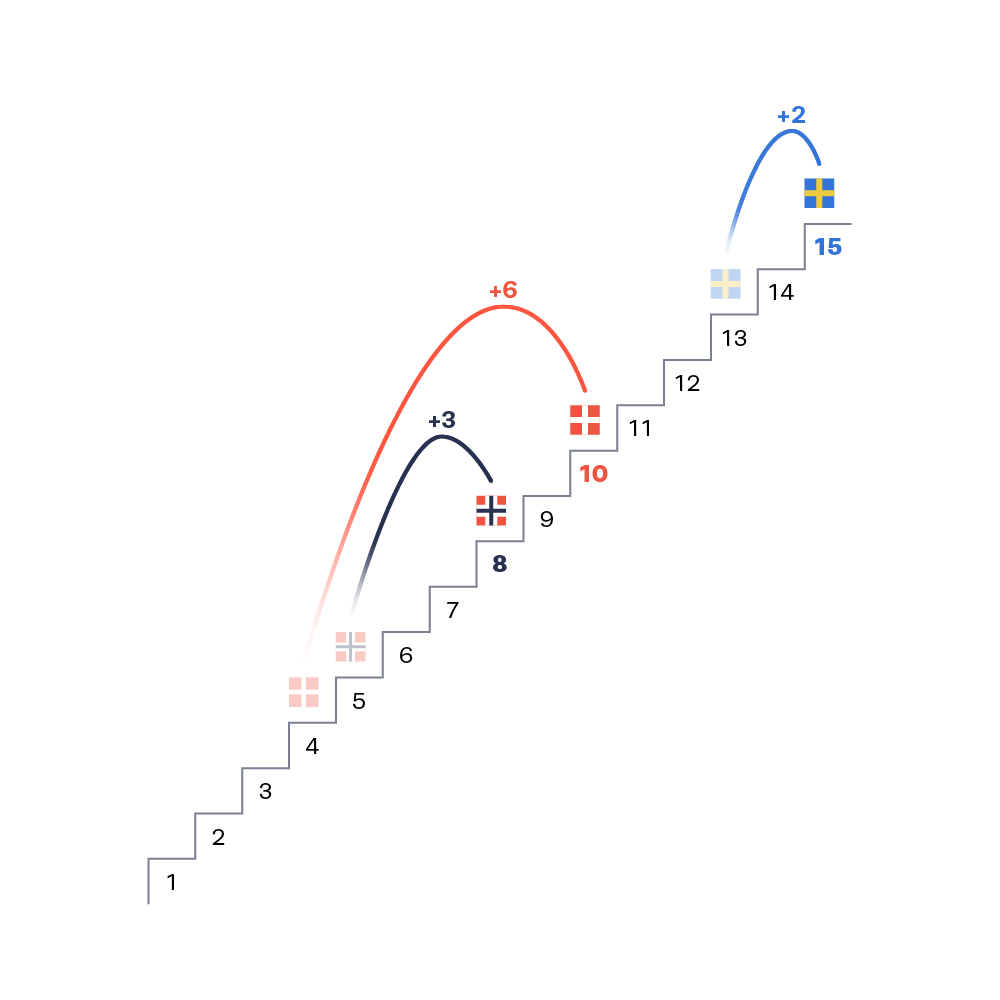 With number 40 I love the step ladder and gradient jump / leap. It's a nice play on progression and a more basic arc chart. The movement up and right simultaneously really adds to the leap effect.
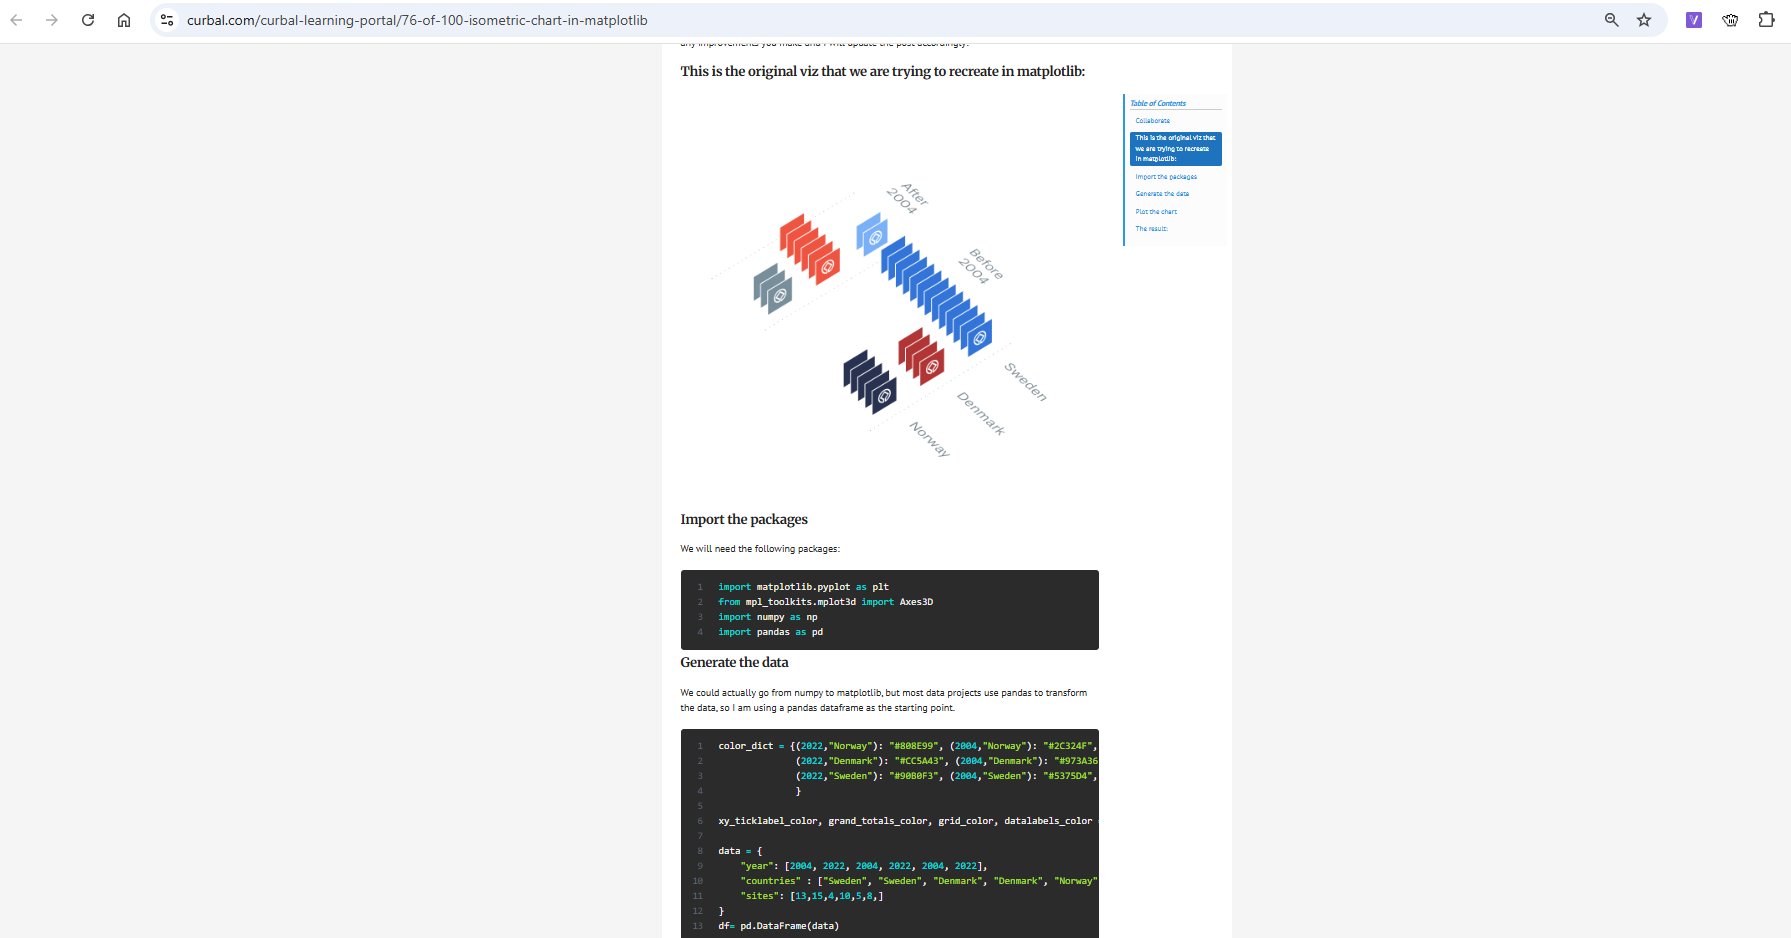 My other favourite is this isometric design. I like the uniformity to it, almost like a filing cabinet?
CJ: We have seen a large shift to people wanting to use “tools”. Your elevation profile plot allows just for this, It’s great you make it available for everyone. What are some of the complexities behind making something like this?
R: I am hosting the tool at pythonanywhere (https://eu.pythonanywhere.com/) and they make this stuff as easy as it gets. I am in their hacker plan, which means not a lot of compute or space so I can’t keep those files in the app, but even if I could, for privacy reasons I wouldn’t do it.
CJ: Recently you’ve shared a little around new projects on elevation profiles, through garmin connect data. For those looking to get started with Garmin connect data, where would you recommend starting?
My other favourite is this isometric design. I like the uniformity to it, almost like a filing cabinet?
CJ: We have seen a large shift to people wanting to use “tools”. Your elevation profile plot allows just for this, It’s great you make it available for everyone. What are some of the complexities behind making something like this?
R: I am hosting the tool at pythonanywhere (https://eu.pythonanywhere.com/) and they make this stuff as easy as it gets. I am in their hacker plan, which means not a lot of compute or space so I can’t keep those files in the app, but even if I could, for privacy reasons I wouldn’t do it.
CJ: Recently you’ve shared a little around new projects on elevation profiles, through garmin connect data. For those looking to get started with Garmin connect data, where would you recommend starting?
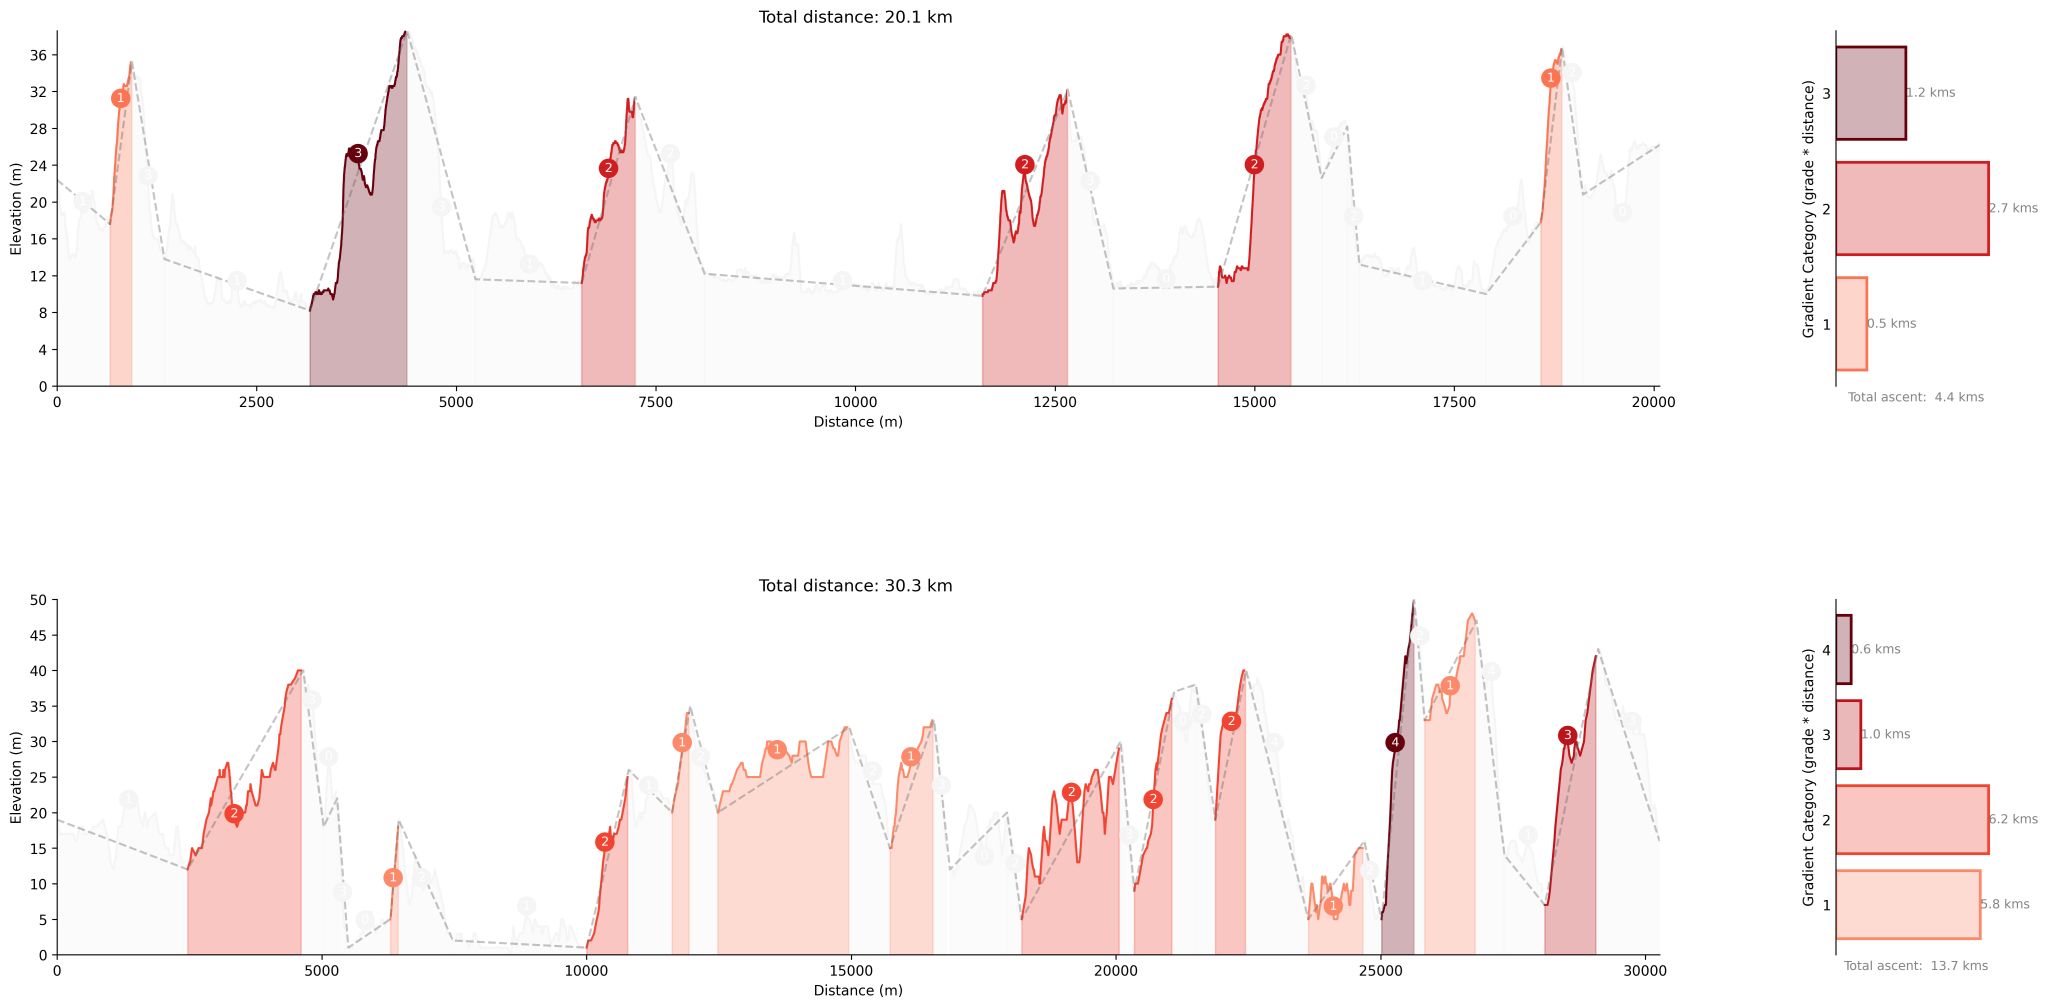 R: This one lets you compare the elevation profiles of two GPS or GPX tracks — really useful if you're training for a specific event and want to see how your training route stacks up against the actual race course.
In short it,
Simplifies the tracks using the Ramer–Douglas–Peucker algorithm to calculate total ascent/descent and the difficulty of climbs and descents.
Difficulty is measured by multiplying the slope grade by the distance — a value of 1000 marks a Category 1 climb, 2000 is Category 2, and so on.
Choose slope type (ascent or descent) using the dropdown.
Segments setting controls how much the track is simplified. A lower number = more detail. Start with 10 and tweak as needed.
Processing time is about 30 seconds for an average-sized GPX file.
Check it out here.
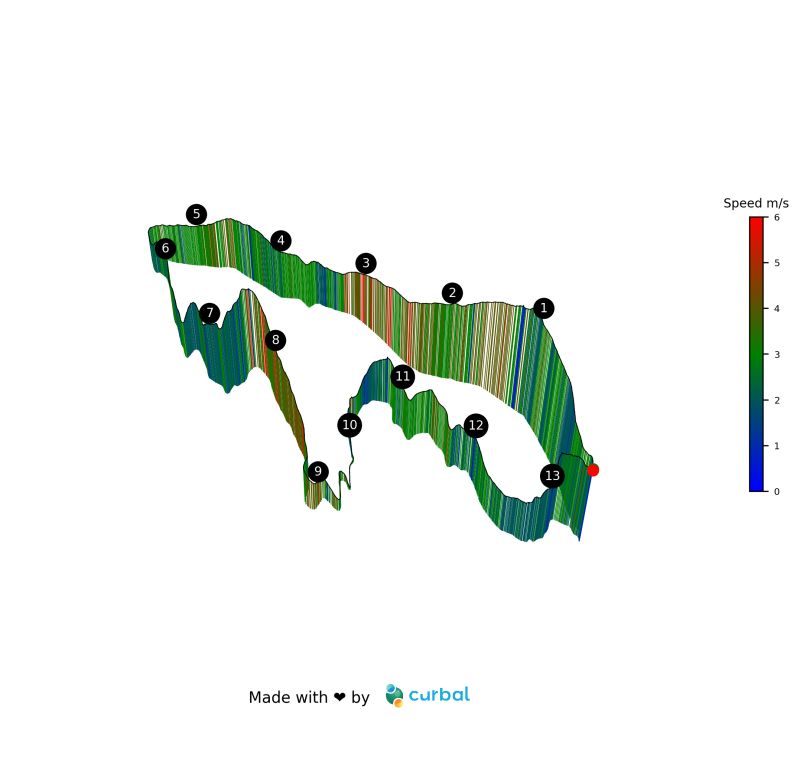
The other project I created is if you want to visualize your activities on a 3D elevation map, you can do it now here.
CJ: Note as its a gpx file this will also work with exporting your strava data!
R: This one lets you compare the elevation profiles of two GPS or GPX tracks — really useful if you're training for a specific event and want to see how your training route stacks up against the actual race course.
In short it,
Simplifies the tracks using the Ramer–Douglas–Peucker algorithm to calculate total ascent/descent and the difficulty of climbs and descents.
Difficulty is measured by multiplying the slope grade by the distance — a value of 1000 marks a Category 1 climb, 2000 is Category 2, and so on.
Choose slope type (ascent or descent) using the dropdown.
Segments setting controls how much the track is simplified. A lower number = more detail. Start with 10 and tweak as needed.
Processing time is about 30 seconds for an average-sized GPX file.
Check it out here.
The other project I created is if you want to visualize your activities on a 3D elevation map, you can do it now here.
CJ: Note as its a gpx file this will also work with exporting your strava data!
 Garmin does not have a public API, so the “easiest” way to get the data is use a python package called garminconnect (https://github.com/cyberjunky/python-garminconnect) . I do have a developer account with Garmin, so hopefully by the end of the year people will be able to connect their own data to get my visualizations. Fingers crossed!
CJ: When we caught up, you walked me through some of your personal garmin metrics for aerobic and anaerobic training, and told me how you automated the refresh process. Could you give a little context as to the steps involved in something like this through the data retrieval, capture, transformation and then visually displaying it on your site? (Pillars of Endurance Running) What tech stack would someone need to know?
Garmin does not have a public API, so the “easiest” way to get the data is use a python package called garminconnect (https://github.com/cyberjunky/python-garminconnect) . I do have a developer account with Garmin, so hopefully by the end of the year people will be able to connect their own data to get my visualizations. Fingers crossed!
CJ: When we caught up, you walked me through some of your personal garmin metrics for aerobic and anaerobic training, and told me how you automated the refresh process. Could you give a little context as to the steps involved in something like this through the data retrieval, capture, transformation and then visually displaying it on your site? (Pillars of Endurance Running) What tech stack would someone need to know?
 R: For public use I recommend using the garminconnect python package (https://github.com/cyberjunky/python-garminconnect) and then use my own server to schedule the scripts that send the data to a database. From there I have other scripts that grab the data and create the visualizations. Once they are ready, I use the pythonanywhere api to push the images to the app. I was doing everything on pythonanywhere but it takes too long to produce the visuals, so this was a better approach.
So the tech stack would be: python (mainly, flask or django and matplotlib) and sql
CJ: It’s exciting to see you are training for Lidingöloppet 30km using the Garmin coach. How has revisualising all this data helped support your training? Has it had significant improvements on your performance?
R: Oh yes! I have never been faster.
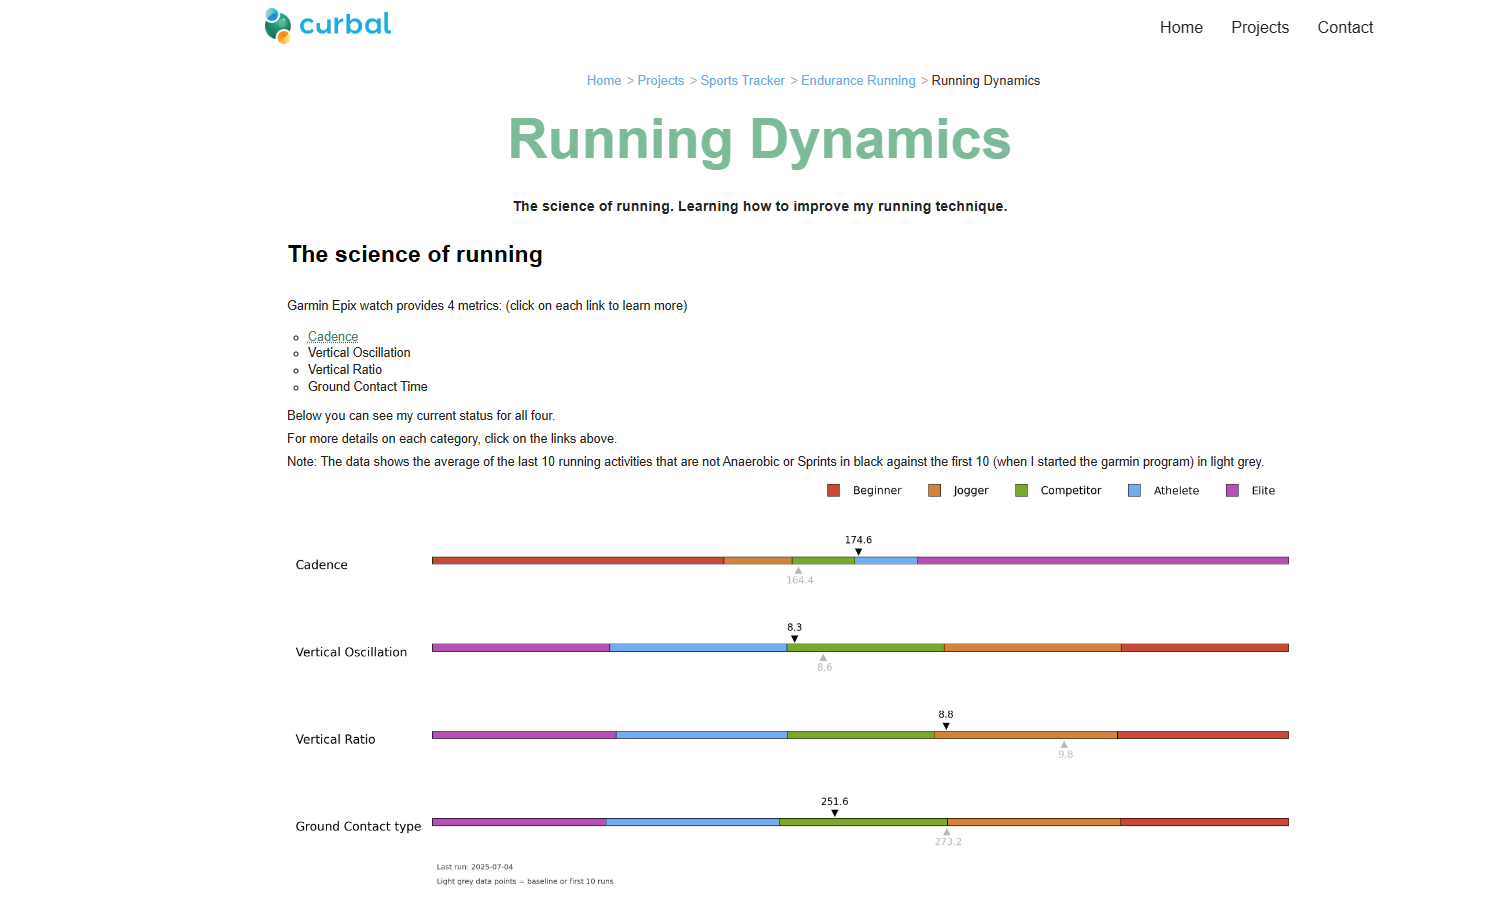
I realized a few things with Garmin coach: there is an efficient way to run and you should try to learn it. Garmin data will let you know if you get better at it (https://www.garmin.com/en-US/garmin-technology/running-science/running-dynamics/)Knowing what your aerobic and anaerobic threshold is, helps planning the races and training.The data also lets you know how much water you lost, the calories for the run, things like that that helps you plan similar runs and food intake better.
R: For public use I recommend using the garminconnect python package (https://github.com/cyberjunky/python-garminconnect) and then use my own server to schedule the scripts that send the data to a database. From there I have other scripts that grab the data and create the visualizations. Once they are ready, I use the pythonanywhere api to push the images to the app. I was doing everything on pythonanywhere but it takes too long to produce the visuals, so this was a better approach.
So the tech stack would be: python (mainly, flask or django and matplotlib) and sql
CJ: It’s exciting to see you are training for Lidingöloppet 30km using the Garmin coach. How has revisualising all this data helped support your training? Has it had significant improvements on your performance?
R: Oh yes! I have never been faster.
I realized a few things with Garmin coach: there is an efficient way to run and you should try to learn it. Garmin data will let you know if you get better at it (https://www.garmin.com/en-US/garmin-technology/running-science/running-dynamics/)Knowing what your aerobic and anaerobic threshold is, helps planning the races and training.The data also lets you know how much water you lost, the calories for the run, things like that that helps you plan similar runs and food intake better.
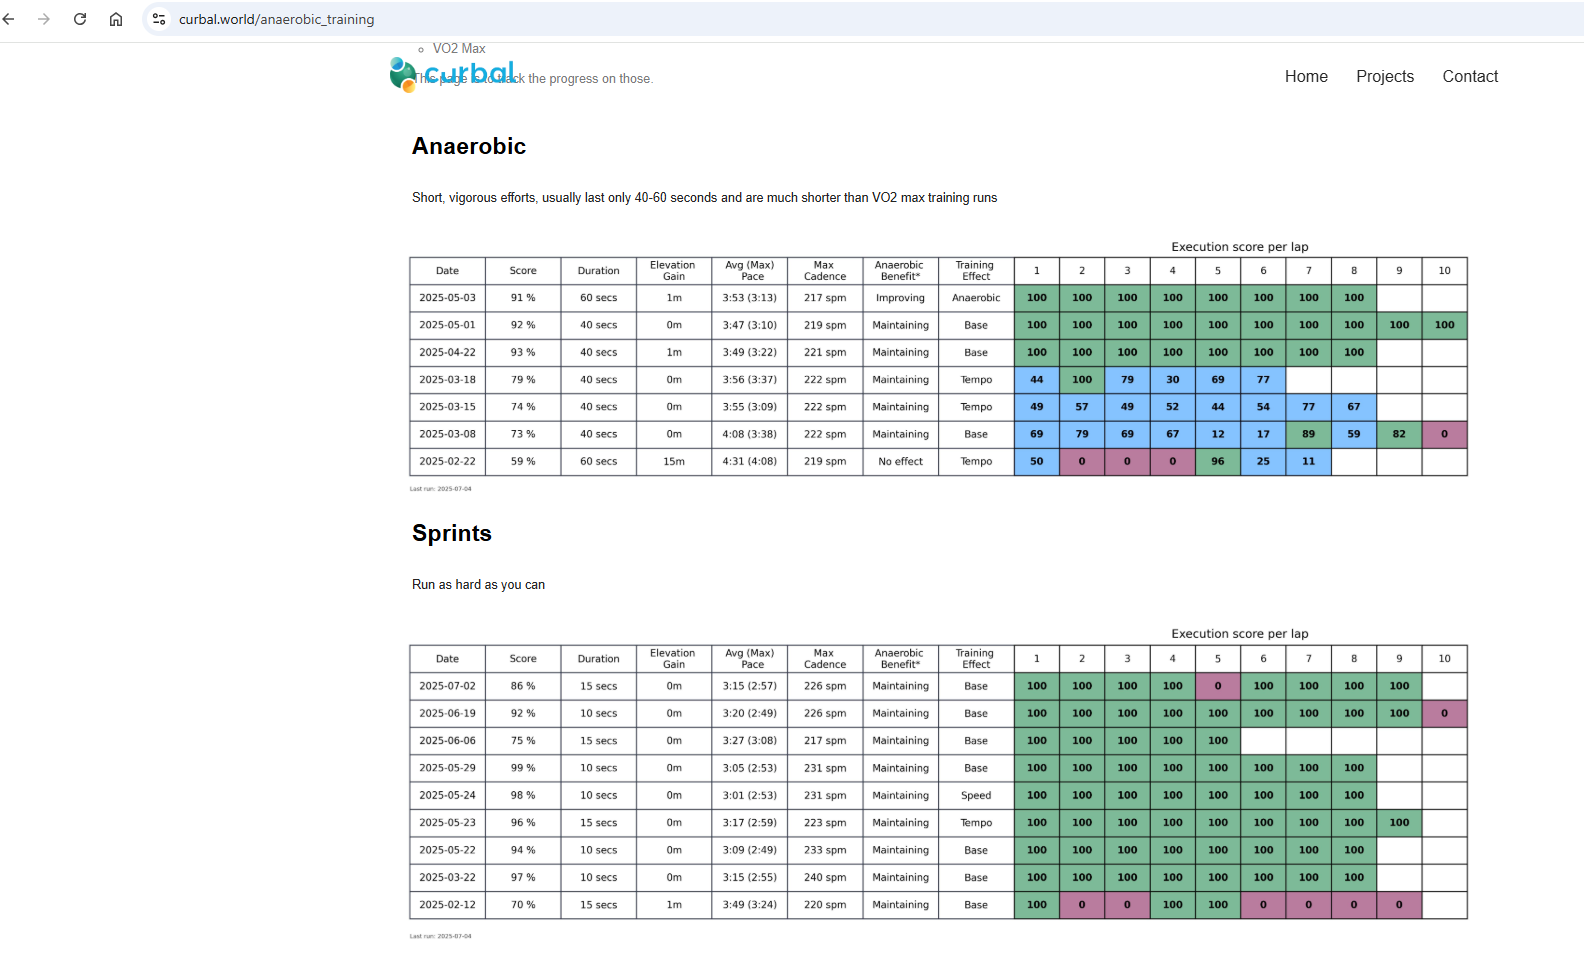 I could go forever, but to answer your second question, I just finished a project that clusters all runs made on the same/similar track so I can check if i am getting faster.
I have picked a few that are relevant for the lidingöloppet and it looks like I am indeed getting faster. That chart is at the end of the page for the anaerobic runs (https://www.curbal.world/anaerobic_training). It also updates automatically as I do more runs on those tracks, so I just need to focus on running faster!
CJ: What is next for you in the health and fitness data world?
R: I have soooo many projects I want to do:
1. I want to have a better follow up of the Garmin coach program
2. Create my own “year in review” (this is one step towards that: https://www.curbal.world/gpx_poster)
3. I want to be able to profile the race courses better so I can plan race day better. The elevation comparison is part of that work.
4. I want to be able to analyze my running technique starting with my vertical oscillation. Python has great packages for that….
The list goes on and on!
As a fun side note, remember that I told you my partner calls me Ivan Drago?
Here is why.
CJ Round-up: It was so much fun chatting with Ruth. What better way to spend time than nerding out over data, and also talking about a shared love for running and passing stories on some of our training plans (or lack of in my case!)
I hope the above conversation gets you excited to explore some of your own health metrics, be it through garmin or beyond - One thing I know is I'm excited to see how some of these new projects formulate in coming months for Ruth.
LOGGING OFF,
CJ
I could go forever, but to answer your second question, I just finished a project that clusters all runs made on the same/similar track so I can check if i am getting faster.
I have picked a few that are relevant for the lidingöloppet and it looks like I am indeed getting faster. That chart is at the end of the page for the anaerobic runs (https://www.curbal.world/anaerobic_training). It also updates automatically as I do more runs on those tracks, so I just need to focus on running faster!
CJ: What is next for you in the health and fitness data world?
R: I have soooo many projects I want to do:
1. I want to have a better follow up of the Garmin coach program
2. Create my own “year in review” (this is one step towards that: https://www.curbal.world/gpx_poster)
3. I want to be able to profile the race courses better so I can plan race day better. The elevation comparison is part of that work.
4. I want to be able to analyze my running technique starting with my vertical oscillation. Python has great packages for that….
The list goes on and on!
As a fun side note, remember that I told you my partner calls me Ivan Drago?
Here is why.
CJ Round-up: It was so much fun chatting with Ruth. What better way to spend time than nerding out over data, and also talking about a shared love for running and passing stories on some of our training plans (or lack of in my case!)
I hope the above conversation gets you excited to explore some of your own health metrics, be it through garmin or beyond - One thing I know is I'm excited to see how some of these new projects formulate in coming months for Ruth.
LOGGING OFF,
CJ