Hi all,
I have a new found love of golf. Don't get me wrong, I am just a Rory fan from the masters, but also love to watch Brysons youtube channel. Realistically, I dont know what I'm doing but its fun to watch and have gone to the extent of signing up to a country club to learn how to play.
Nonetheless, today we will chat about HTML. Some of the data we see on the USOpen website, and how we can start to map some of that information in Tableau.
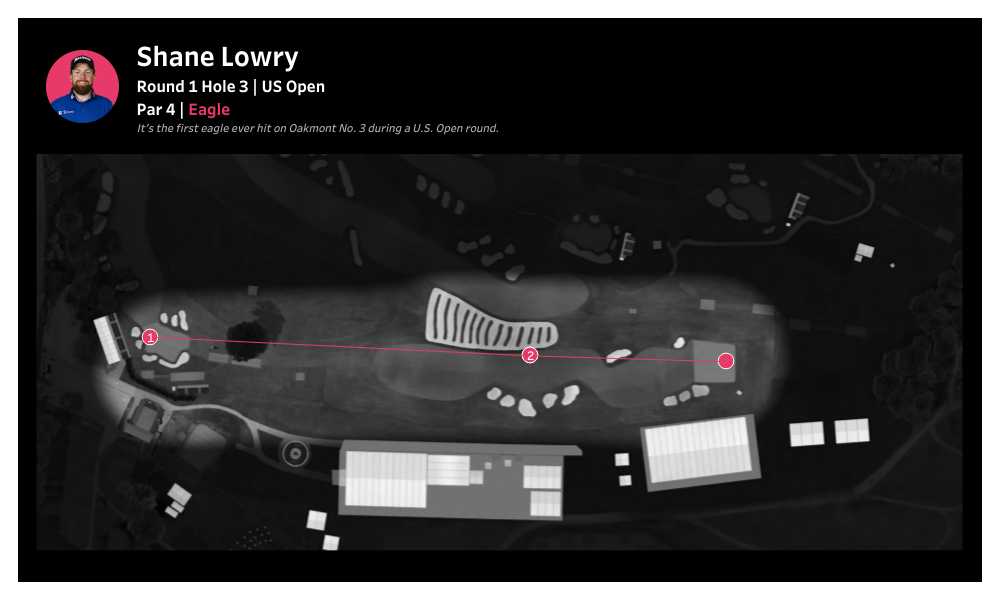
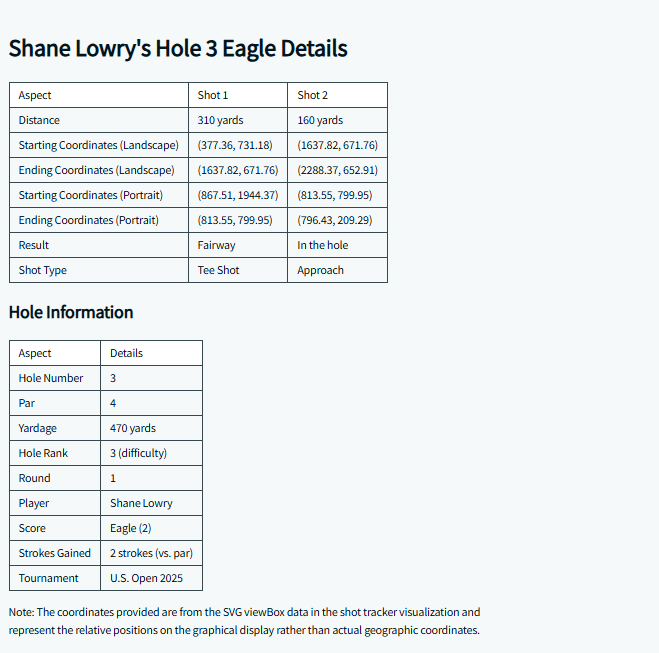
For example, did you see Shane Lowry's eagle on hole 3 from yesterdays opening round?
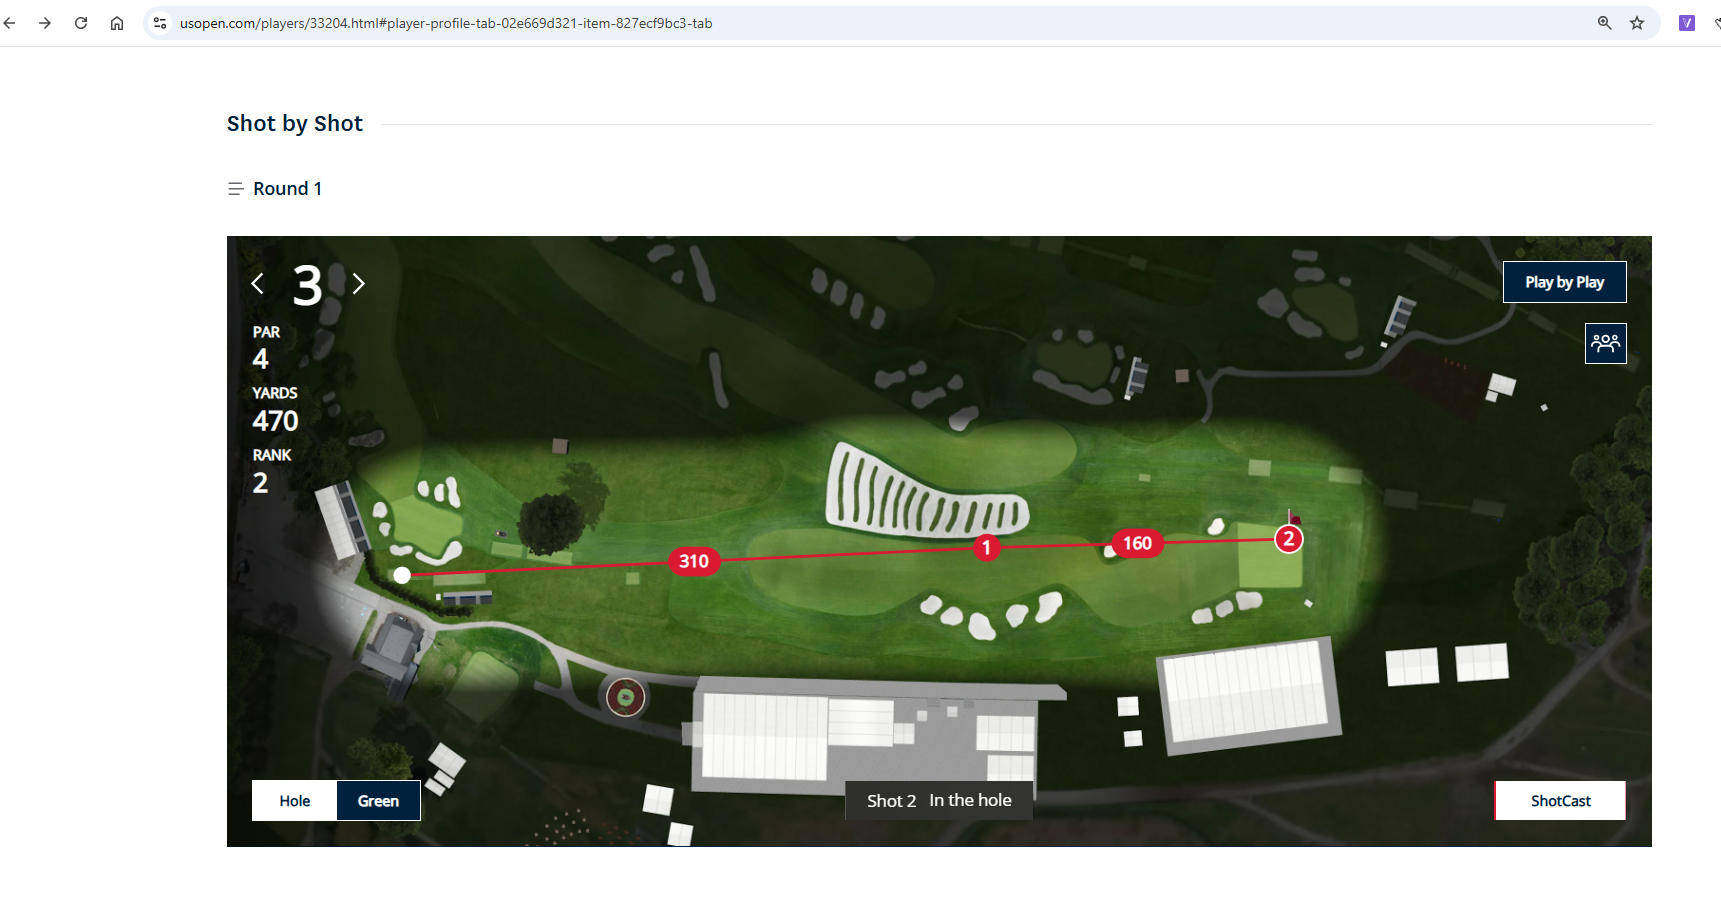
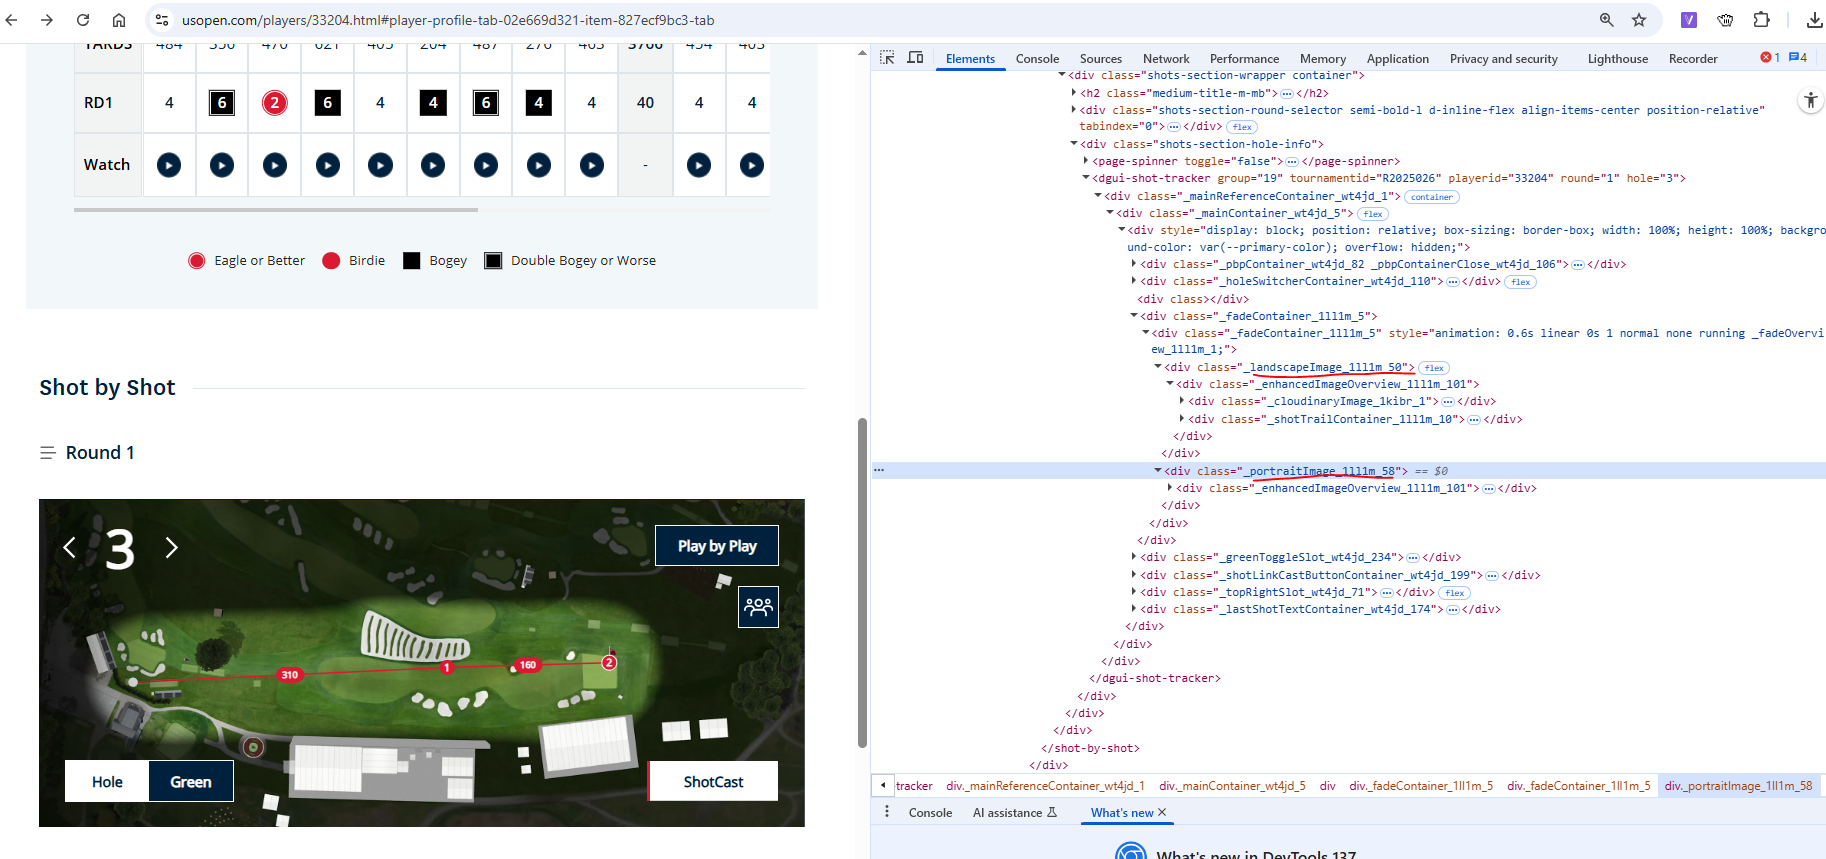
So the US Open website has these wonderful shot by shot images.
It is an SVG overlay on a background image.
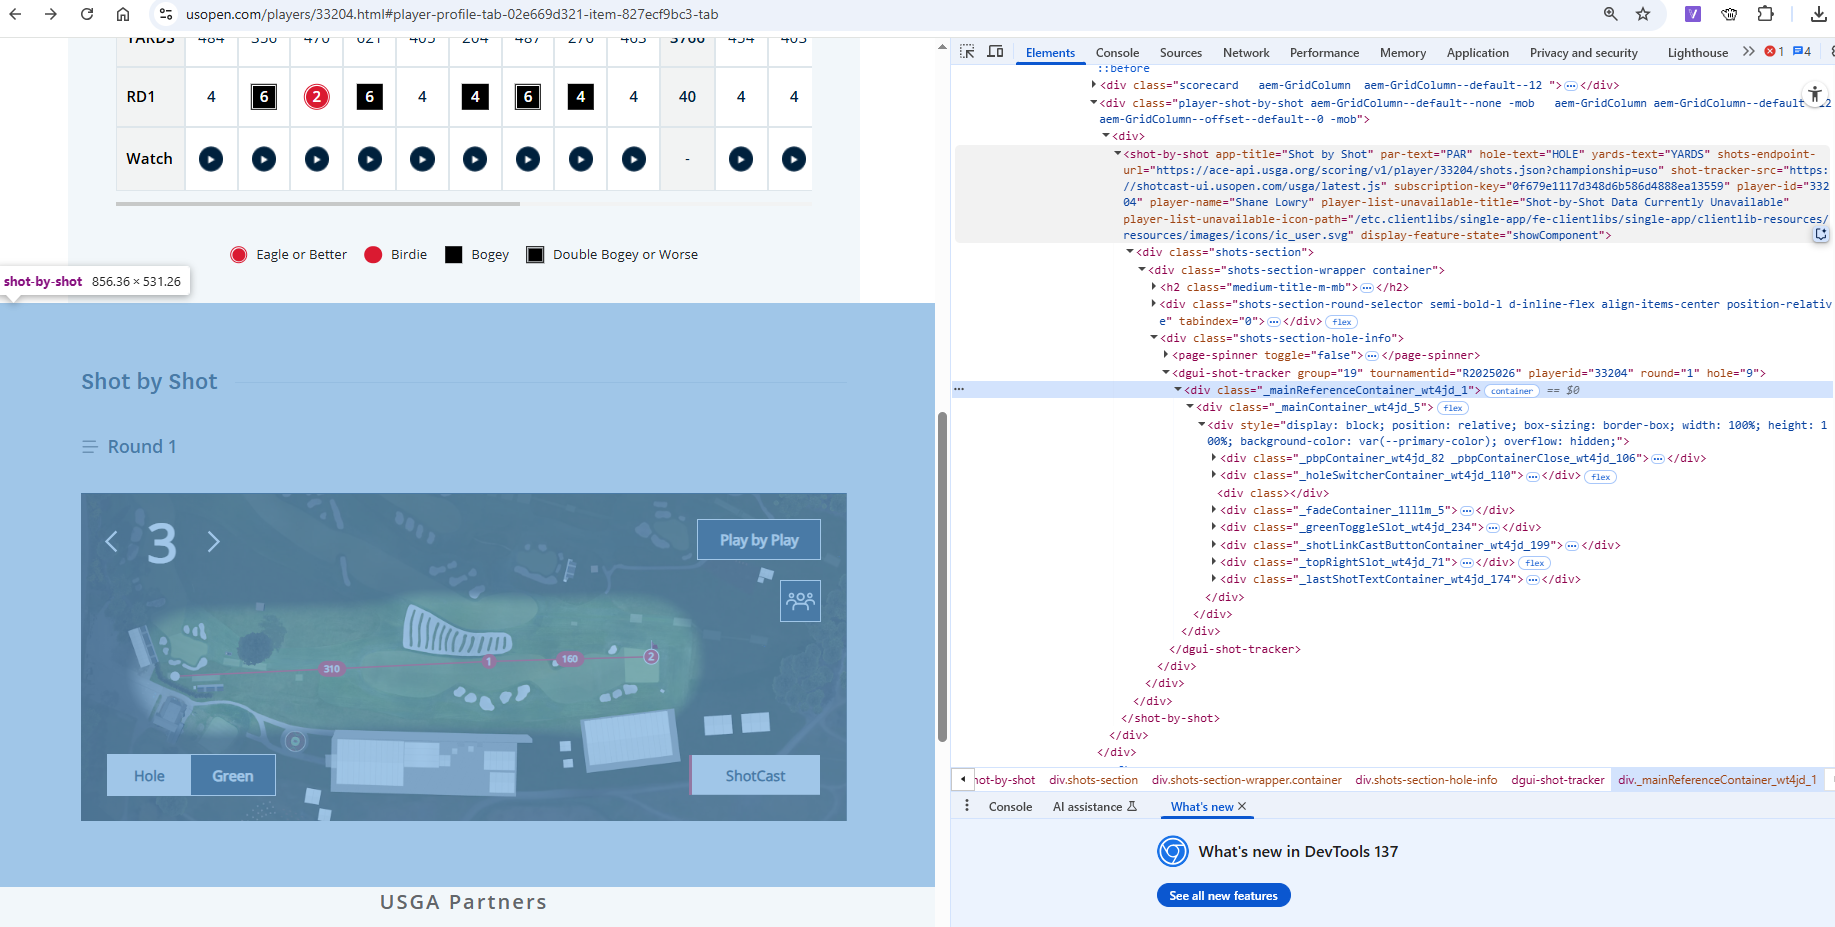
Let's take a little look at the HTML blocks. Right click inspect.
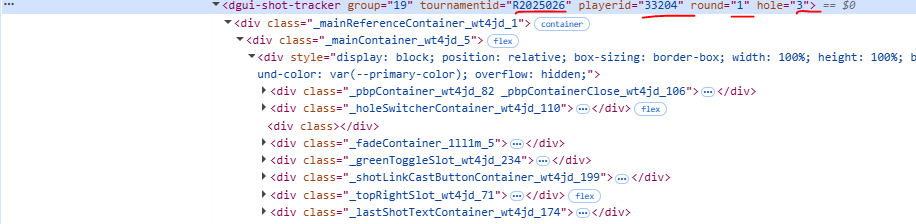
You'll see some information thats quite useful sits within the shot by shot container, the name of the player, their platyer id.
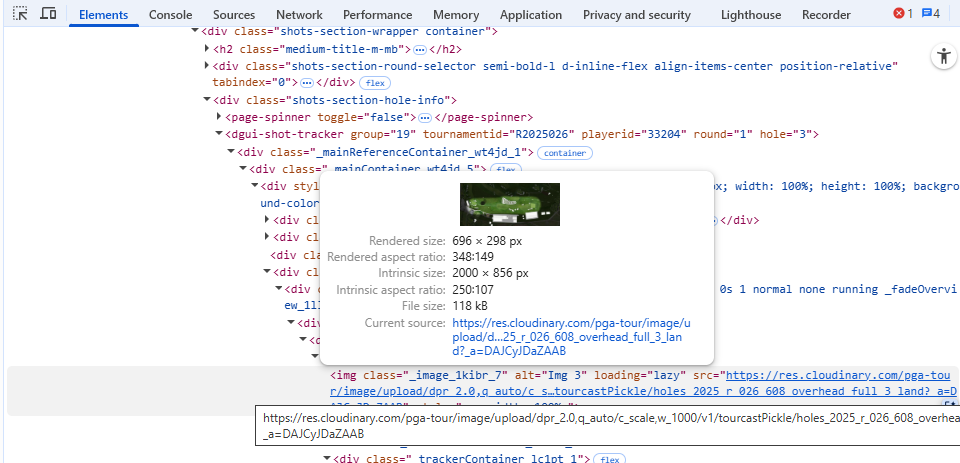
Next thing we can note, is the background image. They have one variation for landscape view (normally on a computer) and one for a mobile view, portrait.
It gives us the direct source to find the original image url. So that we can save it down.
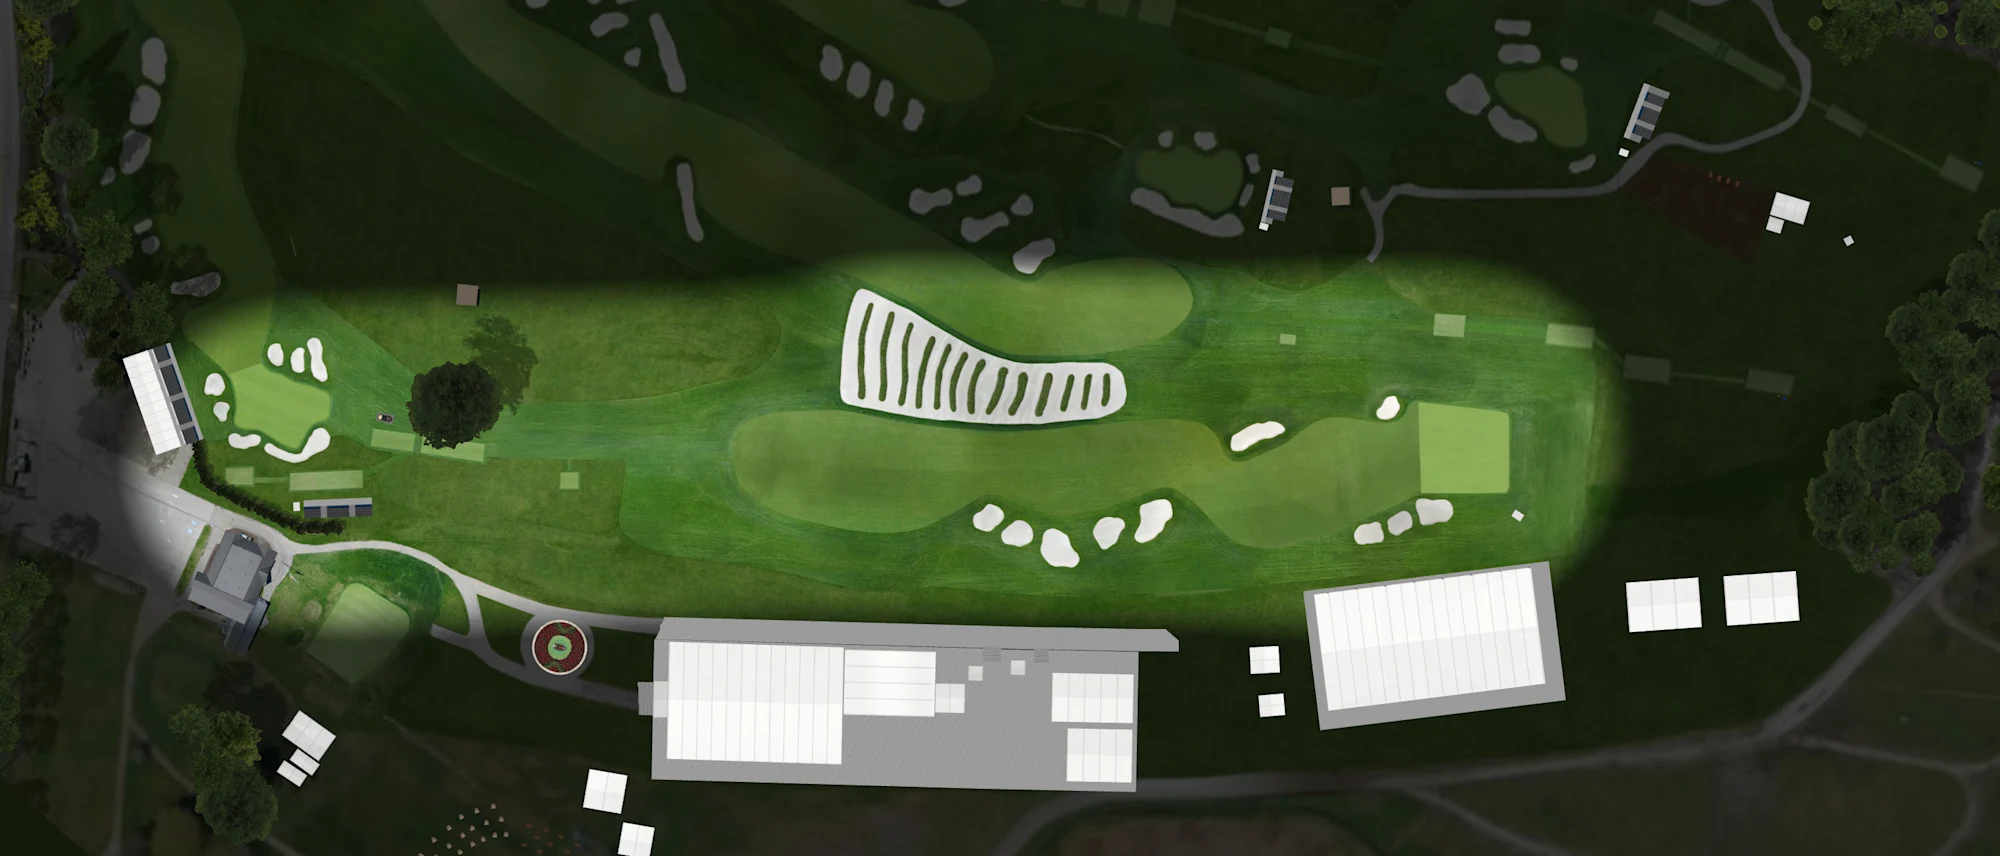
Perfect, here we are.
Save it in a Tableau compatible format (png, jpg)
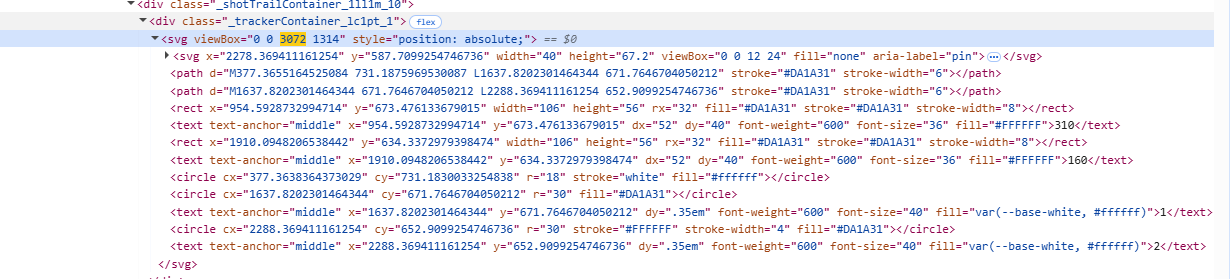
When it comes to mapping this image in Tableau though... we will want to know the size of the image, RELATIVE, to the co ordinates of the shots.
For the landscape image this can be found in the view box.
Landscape orientation: viewBox="0 0 3072 1314"
Width: 3072 units
Height: 1314 units
This viewbox contains all the svg information. Its important to note that these co-ordinates are relative to the image, and of course nothing to do with the ACTUAL course co-ordinates.
From here, we can pull all the x and y values needed. Or ask AI if you're lazy, by dumping in a copy of the HTML.
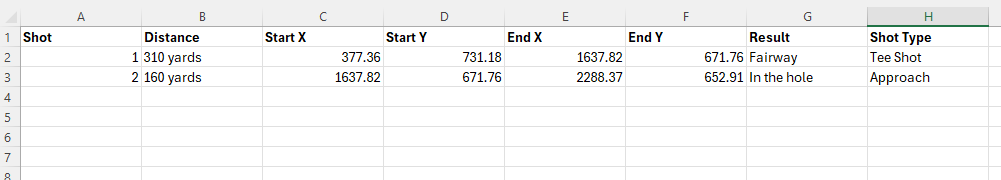
Now for the visualisation aspect to work we need the data in a specific format.
A copy of this data can be found in the repository.
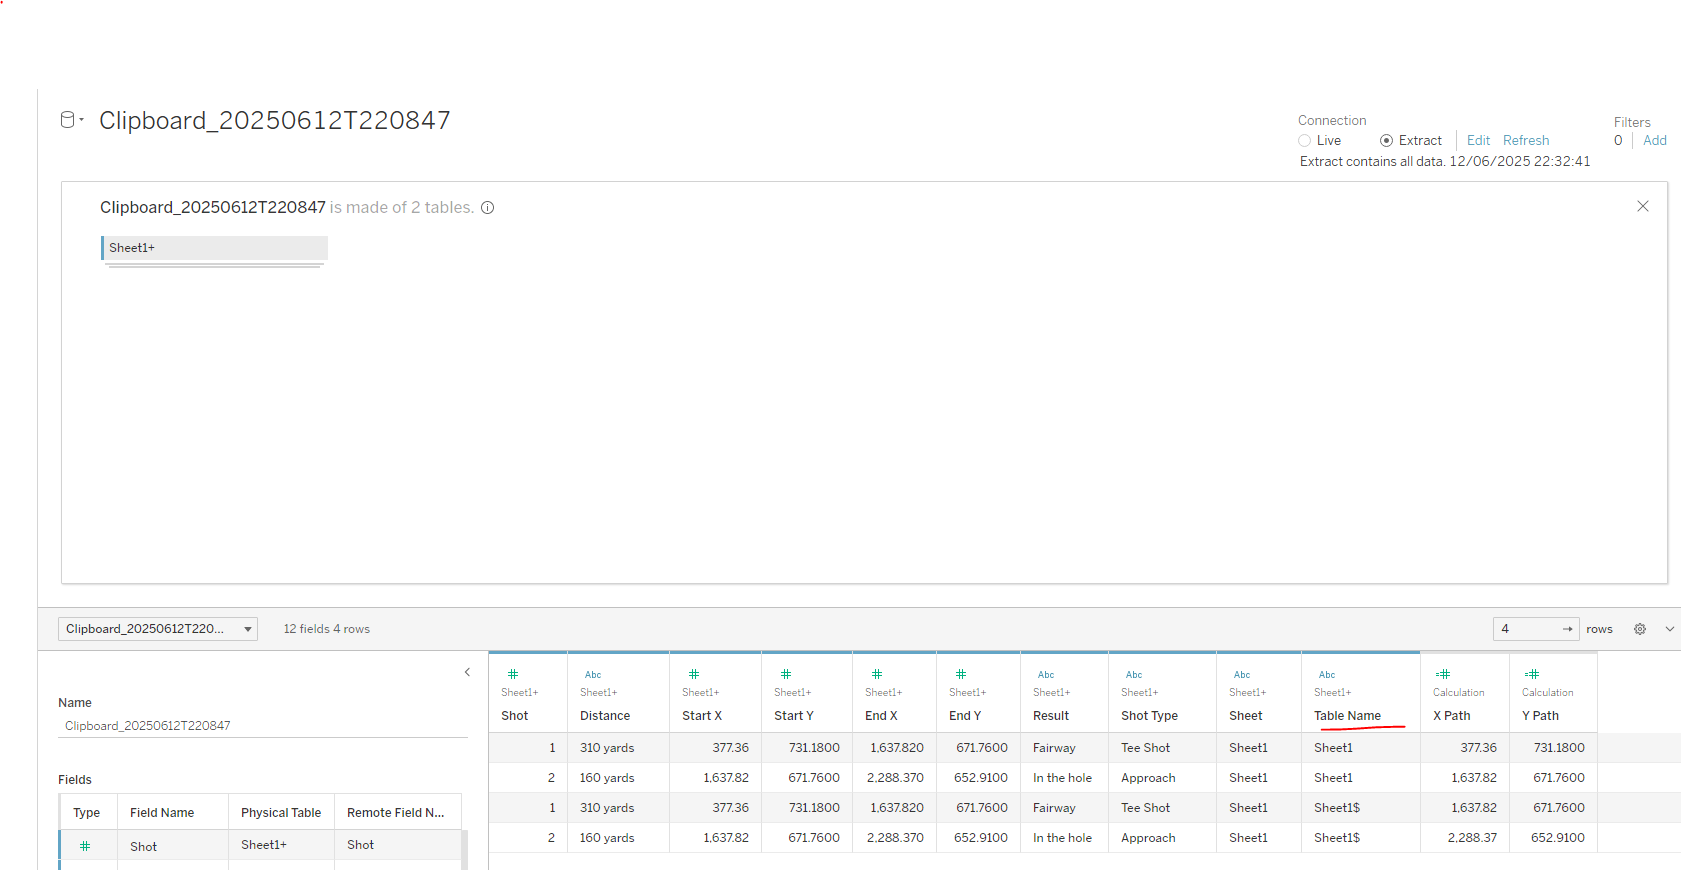
Paste that data into Tableau and union it on itself to get a Table Name column.
The reason we do this is to be able to join the shots together, else we wouldn't have a "flight path" (caveat, yes the flight path won't be completely direct but its the best we can do.)
Two calculations are needed
X Path
if [Table Name] = "Sheet1"
then [Start X] else [End X]
end
and
Y Path
if [Table Name] = "Sheet1"
then [Start Y] else [End Y]
end
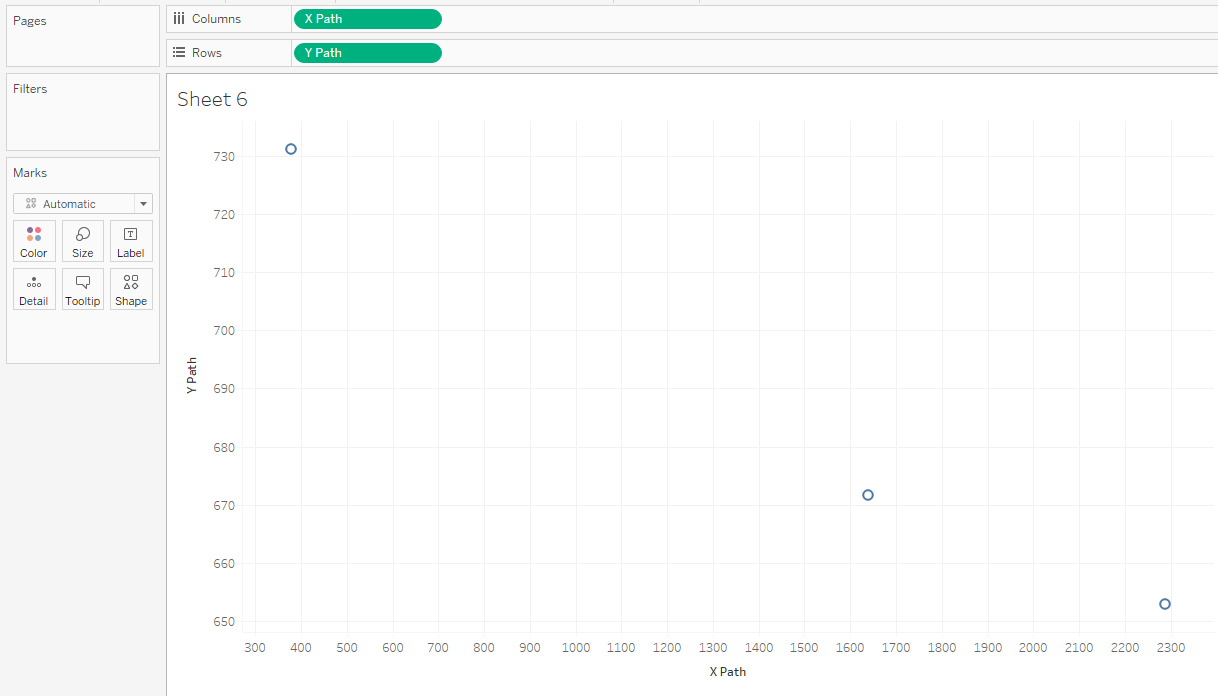
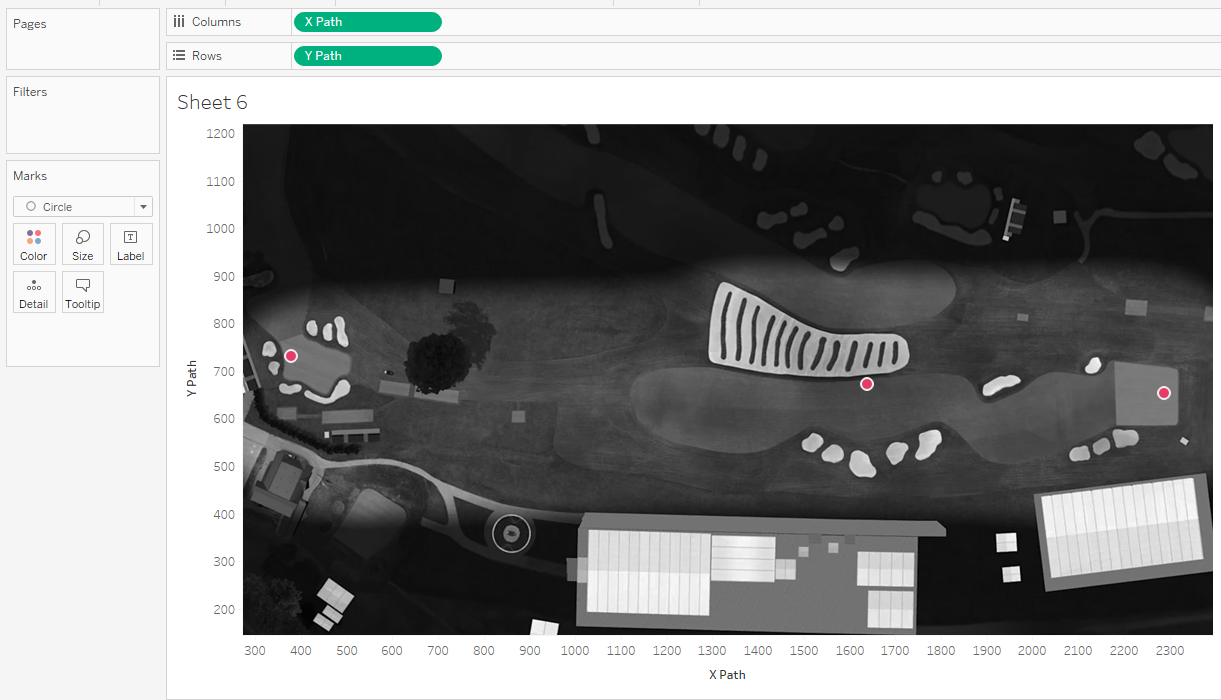
Bring them onto the page as dimensions, and we have a very underwhelming chart.
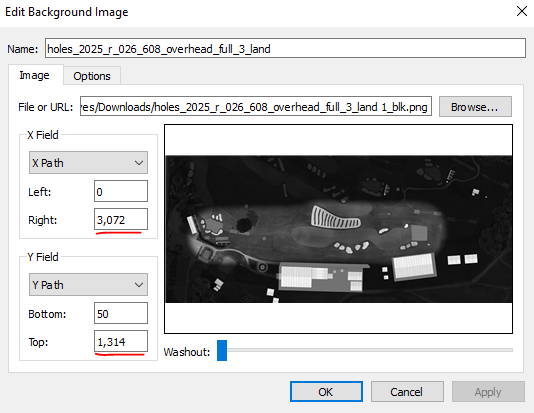
Lets go to map and configure the background.
Let's now input our values from earlier! 3072 & 1314.
& voila. Each of our shot markers.
To add in the lines, dual axis the x path, change the mark to a line, and add shot to detail.
For labelling what i found best was to add max shot to the label, but as middle centre and for end of the line only. That way you dont get the duplicate marks for the circles.
Easy as that, we have just captured a fantastic moment from R1 of the US open, where Shane Lowry hit the first ever eagle on Oakmont hole number 3.
Going Further:
Try webscraping some of this information.
Try compile a full round for your favourite player.
Add in additional image overlays for the pin, or tee box.
 So the US Open website has these wonderful shot by shot images.
 It is an SVG overlay on a background image.
Let's take a little look at the HTML blocks. Right click inspect.
It is an SVG overlay on a background image.
Let's take a little look at the HTML blocks. Right click inspect.
 You'll see some information thats quite useful sits within the shot by shot container, the name of the player, their platyer id.
 Next thing we can note, is the background image. They have one variation for landscape view (normally on a computer) and one for a mobile view, portrait.
 It gives us the direct source to find the original image url. So that we can save it down.
 Perfect, here we are.
Save it in a Tableau compatible format (png, jpg)
Perfect, here we are.
Save it in a Tableau compatible format (png, jpg)
 When it comes to mapping this image in Tableau though... we will want to know the size of the image, RELATIVE, to the co ordinates of the shots.
For the landscape image this can be found in the view box.
When it comes to mapping this image in Tableau though... we will want to know the size of the image, RELATIVE, to the co ordinates of the shots.
For the landscape image this can be found in the view box.
 This viewbox contains all the svg information. Its important to note that these co-ordinates are relative to the image, and of course nothing to do with the ACTUAL course co-ordinates.
From here, we can pull all the x and y values needed. Or ask AI if you're lazy, by dumping in a copy of the HTML.
This viewbox contains all the svg information. Its important to note that these co-ordinates are relative to the image, and of course nothing to do with the ACTUAL course co-ordinates.
From here, we can pull all the x and y values needed. Or ask AI if you're lazy, by dumping in a copy of the HTML.
 Now for the visualisation aspect to work we need the data in a specific format.
 A copy of this data can be found in the repository.
 Paste that data into Tableau and union it on itself to get a Table Name column.
The reason we do this is to be able to join the shots together, else we wouldn't have a "flight path" (caveat, yes the flight path won't be completely direct but its the best we can do.)
Two calculations are needed
X Path
if [Table Name] = "Sheet1"
then [Start X] else [End X]
end
and
Y Path
if [Table Name] = "Sheet1"
then [Start Y] else [End Y]
end
Paste that data into Tableau and union it on itself to get a Table Name column.
The reason we do this is to be able to join the shots together, else we wouldn't have a "flight path" (caveat, yes the flight path won't be completely direct but its the best we can do.)
Two calculations are needed
X Path
if [Table Name] = "Sheet1"
then [Start X] else [End X]
end
and
Y Path
if [Table Name] = "Sheet1"
then [Start Y] else [End Y]
end
 Bring them onto the page as dimensions, and we have a very underwhelming chart.
Lets go to map and configure the background.
Let's now input our values from earlier! 3072 & 1314.
Bring them onto the page as dimensions, and we have a very underwhelming chart.
Lets go to map and configure the background.
Let's now input our values from earlier! 3072 & 1314.
 & voila. Each of our shot markers.
 To add in the lines, dual axis the x path, change the mark to a line, and add shot to detail.
For labelling what i found best was to add max shot to the label, but as middle centre and for end of the line only. That way you dont get the duplicate marks for the circles.
Easy as that, we have just captured a fantastic moment from R1 of the US open, where Shane Lowry hit the first ever eagle on Oakmont hole number 3.
To add in the lines, dual axis the x path, change the mark to a line, and add shot to detail.
For labelling what i found best was to add max shot to the label, but as middle centre and for end of the line only. That way you dont get the duplicate marks for the circles.
Easy as that, we have just captured a fantastic moment from R1 of the US open, where Shane Lowry hit the first ever eagle on Oakmont hole number 3.
 Going Further: